Monitoring PostgreSQL Cluster via Pgpool-II with Prometheus
Database monitoring is important in production. Effective database monitoring helps you to visualize database activities and detect errors. Pgpool-II Exporter can expose Pgpool-II and PostgreSQL cluster's metrics which can be collected by Prometheus. In this post, I will describe how to use Pgpool-II Exporter to monitor Pgpool-II and PostgreSQL cluster's statistics and visualize them with Prometheus and Grafana.
What is Prometheus?
Prometheus is a leading cloud-native monitoring solution. Prometheus collects application metrics from monitored targets which expose Prometheus-formatted metrics. Prometheus metrics exporter provides the endpoint to scrape. The most popular one is node_exporter which collects system metrics such as CPU, memory and disk space usage for Linux servers.
Pgpool-II Exporter
Pgpool-II Exporter uses SHOW command to collect Pgpool-II and PostgreSQL Cluster's metrics, including:
| name | Description | |
|---|---|---|
| pgpool2_frontend_total | Number of total child processes | |
| pgpool2_frontend_used | Number of used child processes | |
| pgpool2_pool_nodes_status | Backend node Status (1 for up or waiting, 0 for down or unused) | |
| pgpool2_pool_nodes_replication_delay | Replication delay | |
| pgpool2_pool_backend_stats_select/insert/update/delete/ddl/other_cnt | SELECT/INSERT/UPDATE/DELETE/DDL/Other statement counts issued to each backend | |
| pgpool2_pool_backend_stats_panic/fatal/error_cnt | Panic/Fatal/Error message counts returned from backend | |
| pgpool2_pool_cache_cache_hit_ratio | Query cache hit ratio | |
| ... | ... |
Building and running Pgpool-II Exporter
First, let's download the repository and build it.
$ cd pgpool2_exporter
$ make
Run Pgpool-II Exporter. Then you should see that Pgpool-II Exporter is now running and exposing metrics on port 9719:
$ export DATA_SOURCE_NAME="postgresql://user:password@hostname:port/dbname?sslmode=disable"$ ./pgpool2_exporter
INFO[0000] Starting pgpool2_exporter (version=0.0.0-dev, branch=master, revision=6419beee395419c5cb15fa12910681b229ff515d) for po
stgresql://pengbo:postgres@127.0.0.1:11000/postgres?sslmode=disable source="pgpool2_exporter.go:610"
INFO[0000] Listening on :9719 source="pgpool2_exporter.go:611"
Metrics
Once Pgpool-II Exporter is running, you can verify the metrics that are being exported using curl command.
You should see output like below:
# TYPE go_gc_duration_seconds summary
go_gc_duration_seconds{quantile="0"} 6.121e-06
go_gc_duration_seconds{quantile="0.25"} 9.33e-06
go_gc_duration_seconds{quantile="0.5"} 1.2386e-05
go_gc_duration_seconds{quantile="0.75"} 1.4918e-05
go_gc_duration_seconds{quantile="1"} 4.5425e-05
go_gc_duration_seconds_sum 0.000265276
go_gc_duration_seconds_count 19
# HELP go_goroutines Number of goroutines that currently exist.
# TYPE go_goroutines gauge
go_goroutines 10
# HELP go_info Information about the Go environment.
# TYPE go_info gauge
Pgpool-II Exporter is now exposing metrics that Prometheus can scrape. Pgpool-II metrics are prefixed with pgpool2_. To view those metrics:
# HELP pgpool2_frontend_total Number of total child processed
# TYPE pgpool2_frontend_total gauge
pgpool2_frontend_total 32
# HELP pgpool2_frontend_used Number of used child processes
# TYPE pgpool2_frontend_used gauge
pgpool2_frontend_used 1
# HELP pgpool2_last_scrape_duration_seconds Duration of the last scrape of metrics from Pgpool-II.
# TYPE pgpool2_last_scrape_duration_seconds gauge
pgpool2_last_scrape_duration_seconds 0.00194464
# HELP pgpool2_last_scrape_error Whether the last scrape of metrics from Pgpool-II resulted in an error (1 for error, 0 for success).
# TYPE pgpool2_last_scrape_error gauge
pgpool2_last_scrape_error 0
# HELP pgpool2_pool_backend_stats_ddl_cnt DDL statement counts issued to each backend
# TYPE pgpool2_pool_backend_stats_ddl_cnt gauge
pgpool2_pool_backend_stats_ddl_cnt{hostname="/tmp",port="11002",role="primary"} 24
pgpool2_pool_backend_stats_ddl_cnt{hostname="/tmp",port="11003",role="standby"} 0
# HELP pgpool2_pool_backend_stats_delete_cnt DELETE statement counts issued to each backend
# TYPE pgpool2_pool_backend_stats_delete_cnt gauge
pgpool2_pool_backend_stats_delete_cnt{hostname="/tmp",port="11002",role="primary"} 5
pgpool2_pool_backend_stats_delete_cnt{hostname="/tmp",port="11003",role="standby"} 0
Configuring Prometheus and Grafana
This section describes how to configure Prometheus and Grafana. If you have not installed Prometheus Grafana and Prometheus, please visit their documentation for installation.
Edit configuration file prometheus.yml to add the target to scrape.
scrape_configs:
- job_name: 'pgpool'
static_configs:
- targets: ['localhost:9719']
Start Prometheus and Grafana.
# ./prometheus --config.file=./prometheus.yml
# systemctl start grafana-server
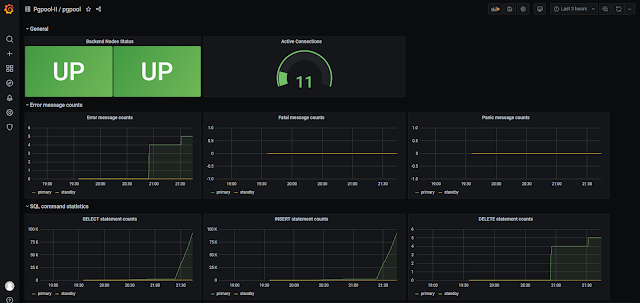
After creating a Prometheus data source to Grafana you can add the following graphs.
Conclusion
In the post I described how to use Pgpool-II Exporter in a local environment. I hope it helps to monitor your PostgreSQL cluster and Pgpool-II's statistics. In future blogs, I will describe how to install and use Pgpool-II Exporter in Docker and Kubernetes.


Comments
Post a Comment