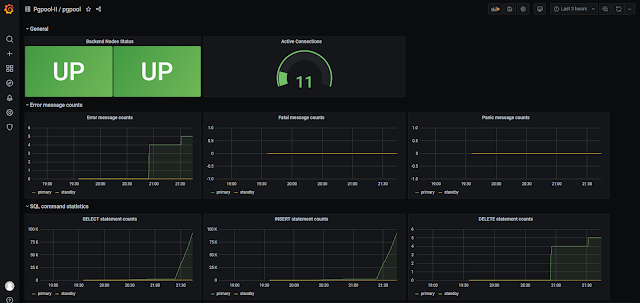
Monitoring PostgreSQL Cluster via Pgpool-II with Prometheus

Database monitoring is important in production. Effective database monitoring helps you to visualize database activities and detect errors. Pgpool-II Exporter can expose Pgpool-II and PostgreSQL cluster's metrics which can be collected by Prometheus . In this post, I will describe how to use Pgpool-II Exporter to monitor Pgpool-II and PostgreSQL cluster's statistics and visualize them with Prometheus and Grafana . What is Prometheus? Prometheus is a leading cloud-native monitoring solution. Prometheus collects application metrics from monitored targets which expose Prometheus-formatted metrics. Prometheus metrics exporter provides the endpoint to scrape. The most popular one is node_exporter which collects system metrics such as CPU, memory and disk space usage for Linux servers. Pgpool-II Exporter Pgpool-II Exporter uses SHOW command to collect Pgpool-II and PostgreSQL Cluster's metrics, including: name Description pgpool2_frontend_total Number ...